Changelog
Follow up on the latest improvements and updates.
RSS
We have released a new CRM integration feature available for Redtail and Wealthbox CRMs. Hubly will now automatically sync meeting data with your CRM allowing you to import all of your meeting types or event categories directly into the Hubly client card.
We found that only 14% of client households in Hubly had an associated meeting date.
Why does it matter? Meeting dates unlock some of the most powerful automations and insight dashboards in Hubly. With meeting data, you can automate reminders to schedule a client meeting six months after your last one, or even run insight reports to highlight clients you haven’t met with this year.
How to Enable Client Meeting Dates Sync
To get started, navigate to Integration Settings in your Hub Settings. Here, you can toggle the Meeting Dates Sync to “on.”

Once enabled, you’ll be able to edit imported meeting types and choose which ones Hubly should sync. After configuring your preferences, Hubly will automatically sync with your CRM. Depending on the volume of meeting data, this process may take between 2-10 minutes. Once complete, meeting data will appear on the relevant client cards.

After the sync, our bi-directional meeting sync integration ensures that any new meeting dates added in your CRM will sync with Hubly—and vice versa.

To add meetings in Hubly, simply click Add Meeting in a client card, complete the meeting information, and you’ll see the sync status reflected in your CRM.


Find out More
Learn how to enable meeting sync, set up automations, and leverage insights from client meeting data here.
This feature is limited to the Business and Scale plans. To find out what plan you are on, visit the Account Settings in your Hub Settings.
new
Forms & Conditional Logic
Introducing Task Forms!
Hubly's Forms help your firm:
- Turn key client info into actionable data
- Use common formatting, such as checkboxes, single-select drop downs, and numbers to make data entry a breeze
- Lay the groundwork for more advanced features, such as Conditional Logic within Workflows, to further automate your business
Check out this video to learn more!
For more details, click here
new
Forms & Conditional Logic
Introducing Conditional Logic for Workflow Tasks!
Hubly's Conditional Logic for Workflow Tasks help your firm:
- Further automate your business by setting the stage to take your clients through customized processes
- Make carrying out work a breeze by viewing and completing only the tasks relevant to the client's specific situation
- Advance beyond checklists and into a flexible, yet well-documented, processes and proceduresmanual to carry out across your firm
Check out this video to learn more!
For more details, click here
new
Forms & Conditional Logic
3 Most Valuable Use Cases for Forms & Conditional Logic within Workflows
Forms & Conditional Logic within Workflows are built to standardize client service records and data across your firm, and this feature really shines in the following 3 use cases:
- New Client Onboarding
- Accounts & Money Movement
- Financial Planning
Check out this video to learn more!
For more details, click here
new
Reporting
Forms & Conditional Logic
Introducing Insight Dashboards: Forms Report!
This new Insight Dashboards Forms Report helps your firm:
- View the data in a Client Form Field for an even more customized look at the results of your client servicing
- Track the actual amount of money that came in out of a total opportunity sizefor sales pipeline reporting
Check out this video to learn more!
For more details, click here
new
Reporting
Visualization
Introducing Insight Dashboards!

Hubly’s new Insight Dashboards feature
utilizes the data from work carried out across firms with two or more team members
to:- Turn activity in Hubly into easy-to-use business intelligence dashboards
- Provide clarity, alignment, and actionable insights from your firm to prevent work from slipping through the cracks
- Identify bottlenecksbefore they reach your clients,fix inefficient processes, and improve your client servicing and forecasting
- See who is being over- or under-utilized in your firm to improve productivity, manage workloads, and make informed hiring decisions
Insight Dashboards are
valuable for firms with multiple team members
. Visually analyze the data generated across the team in a single space. Effortlessly track client growth, team capacity, and see where processes might be breaking down or taking too long.To enable Insight Dashboards,
you must be an Admin in your Hub
. Click your name in the top right corner of your Hub, then click “Settings”. From there, click the ellipses (three dots) next to a user’s name in the Users table, and then click “Enable Insights”. This will turn on Insight Dashboards for this user.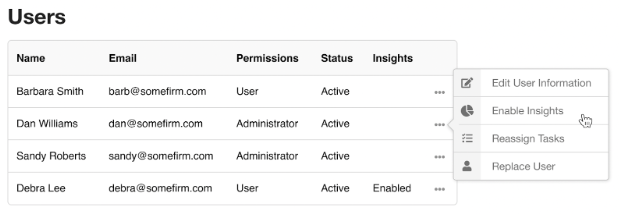
*Please note: A limited amount of users per firm can receive access to Insight Dashboards.
Once enabled, click “Insights” in the top right corner of your main Hub screen. From there, select one of the many Dashboards Hubly has launched to view actionable data generated by your firm.

Try it out for yourself and don't forget to Like and Leave Your Feedback letting us know how we can continue to improve your experience in Hubly!
new
Reporting
Visualization
Our 3 Favorite Insight Dashboards!
Hubly's powerful Insight Dashboards functionality helps:
- Easily track your contact with clients
- Distribute work evenly across your team for optimal productivity
- Spot process bottlenecks to improve efficiencies
While we've launched over a dozen Insight Dashboards,
below are 3 of our favorites
to help you kick off your journey in Insights Dashboards:- Weekly Activity Summary
- Client Meetings Overview
- Client Workflow Completion History
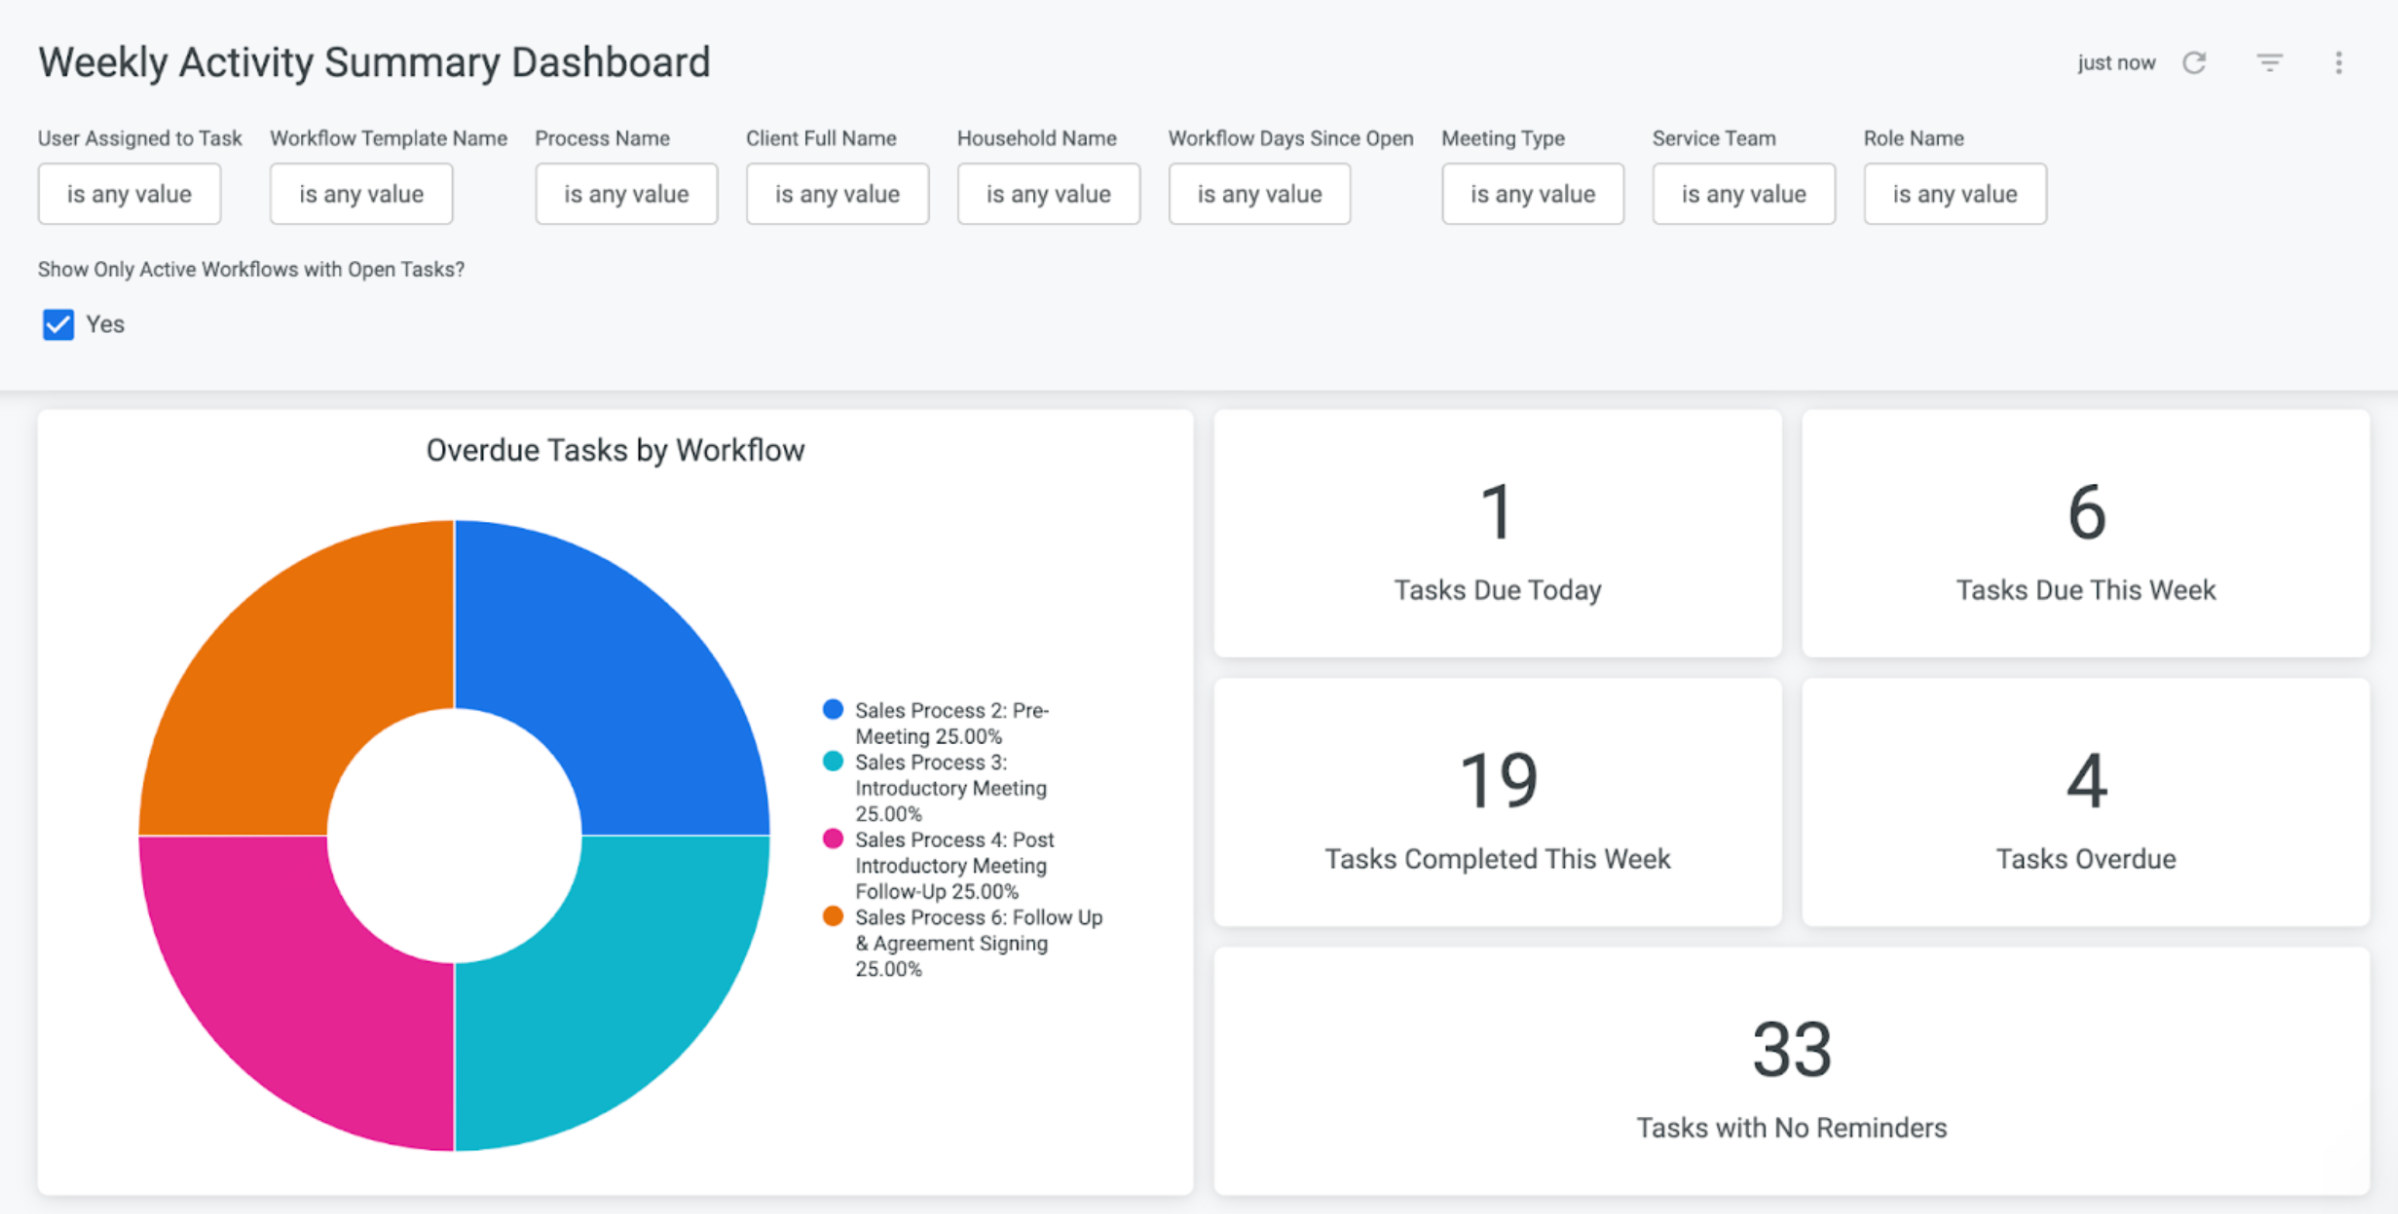
Weekly Activity Summary
This dashboard shows pending tasks, workflows, and meetings for the current week. It’s best used to see what work is pending or in progress for the current week. It also helps give visibility into overdue tasks or workflows that have been open for some time.
Client Meetings Overview
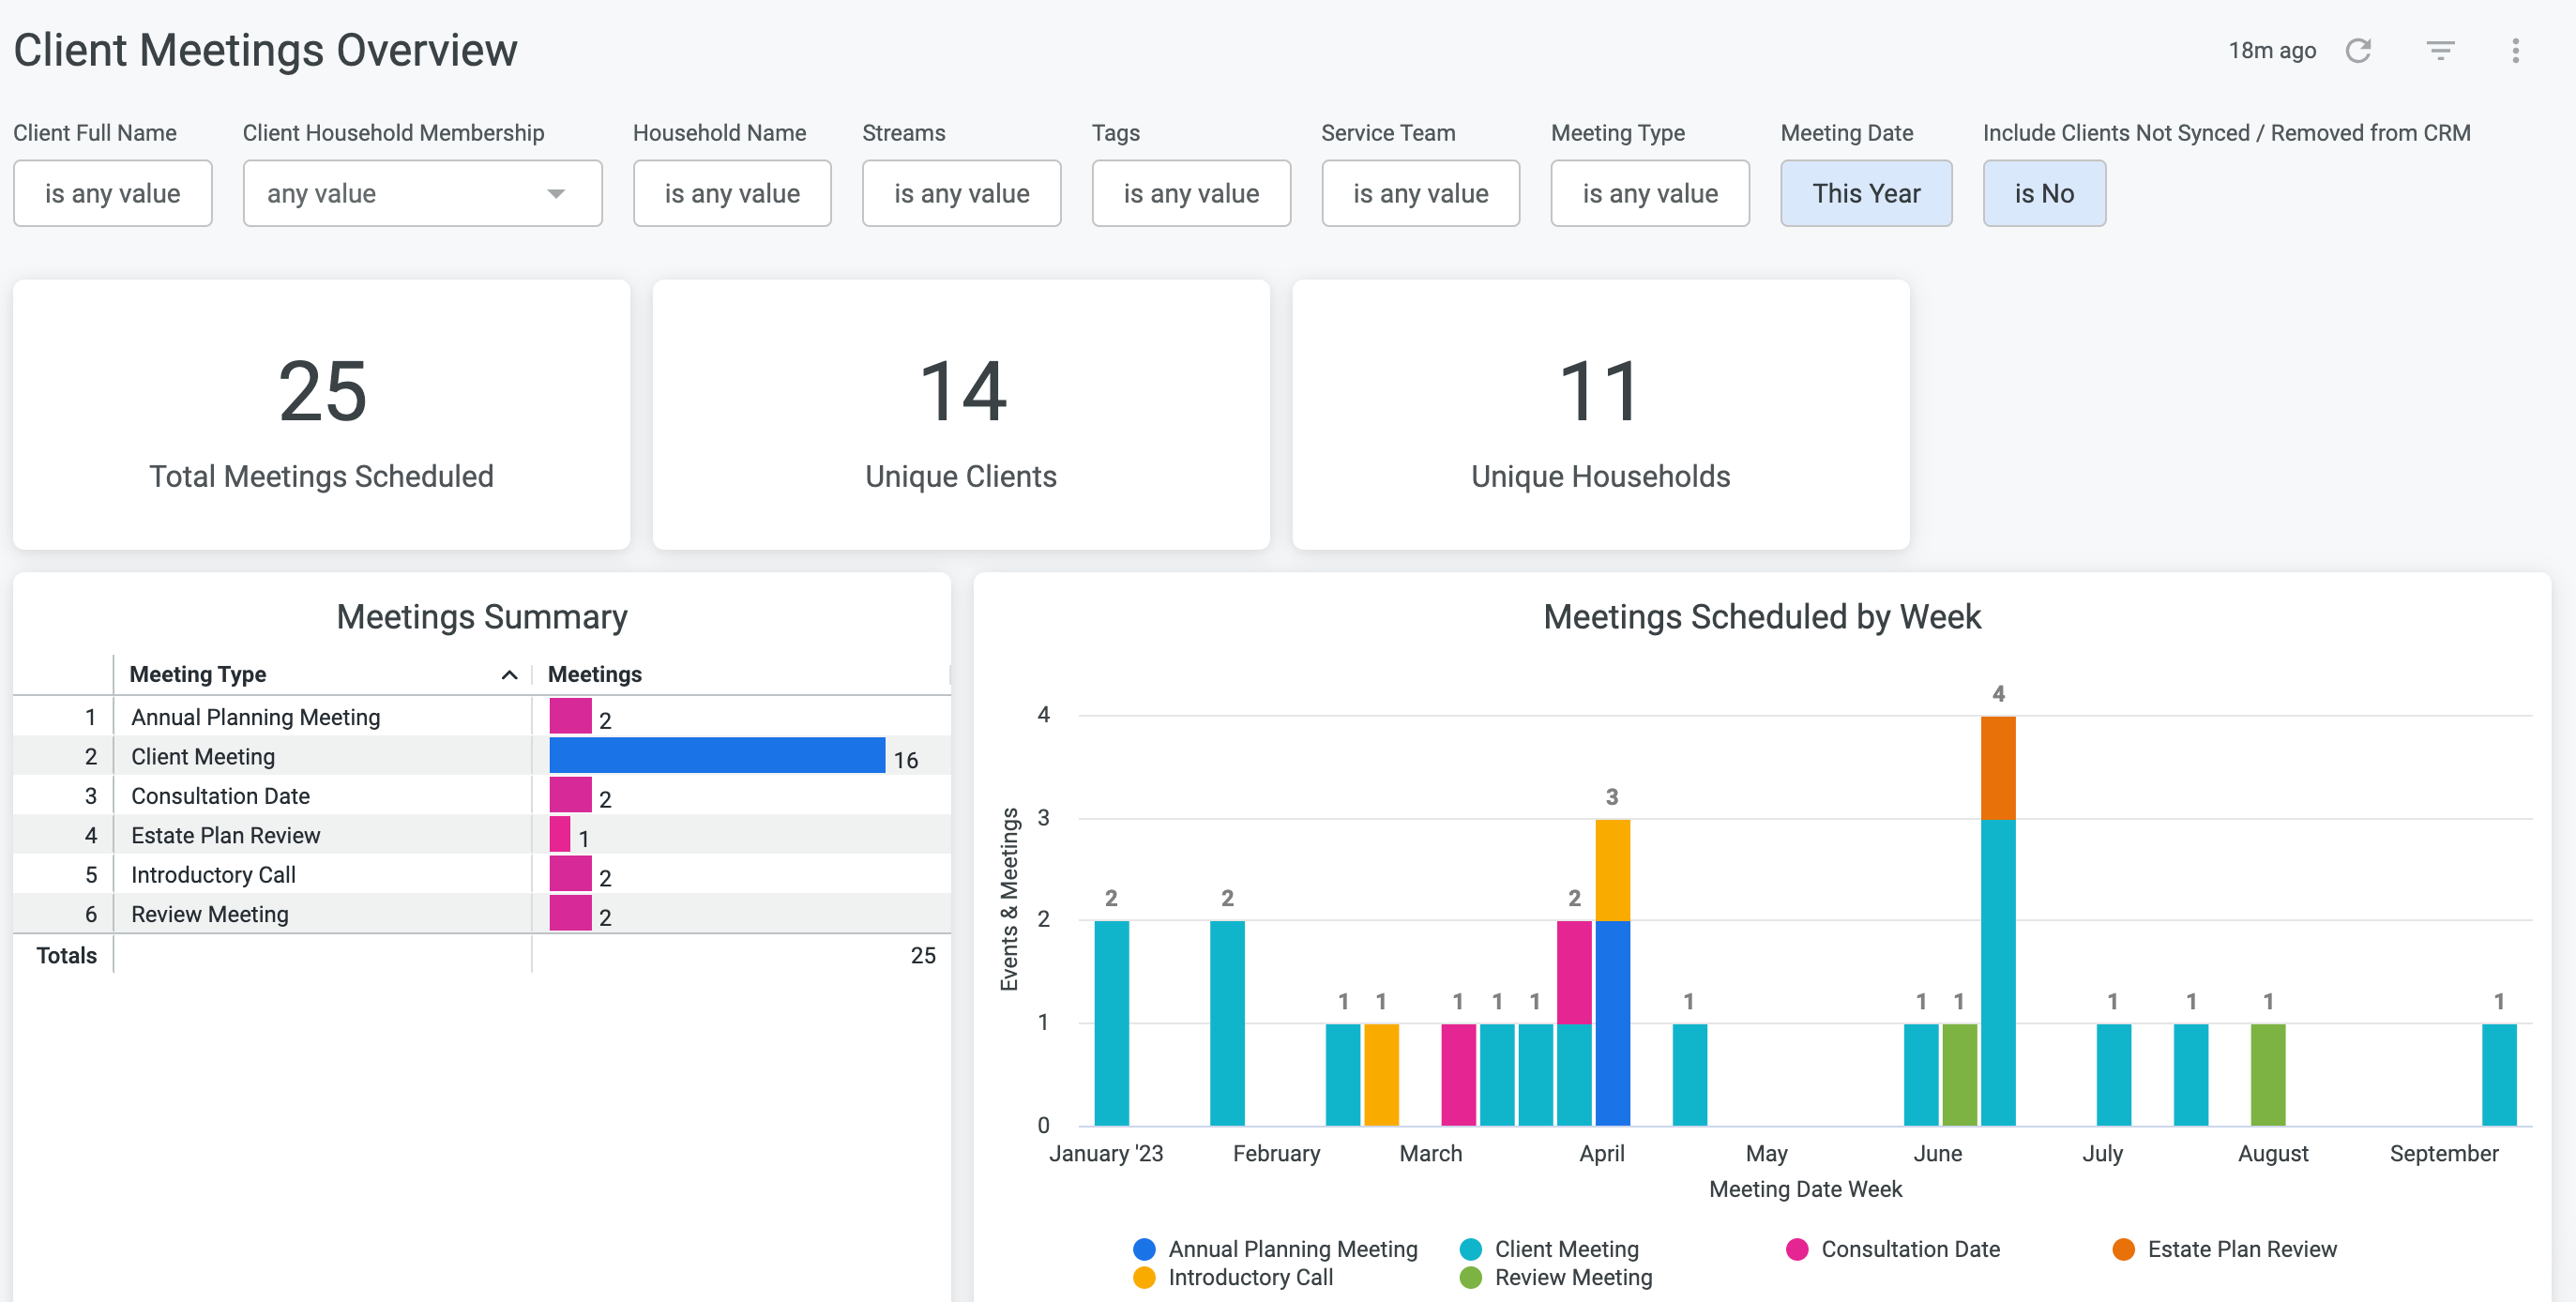
We love this Dashboard because it:
- Helps your team forecast busy season so you can plan accordingly and grow your business
- Is built with compliance in mind so you can speak to your clients when you need to
Client Workflow Completion History
The Client Workflow Completion History Dashboard:
- Helps spot breakdowns in processes by displaying how long active Workflows have been open
- Gives your firm KPIs to track, which can be powerful when coupled with alerts functionality
Try it out for yourself and don't forget to Like and Leave Your Feedback letting us know how we can continue to improve your experience in Hubly!
new
Reporting
Set up Alerts with Insight Dashboards
Alerts are a valuable way to
automatically notify your team when a particular threshold has been exceeded
on one of your Insight Dashboard. They can be a useful trigger for KPI tracking
, and helpful reminders to take action, or investigate further.To set up an alert, click the small bell icon in the top right corner of any piece of data:

Using the drop downs, set up the condition that you would like to trigger the alert, by entering a value you’d like to compare against and selecting how you’d like to make the comparison.
Provide one or more email addresses to send the alert to, and select how often and what time you’d like the alert to run:
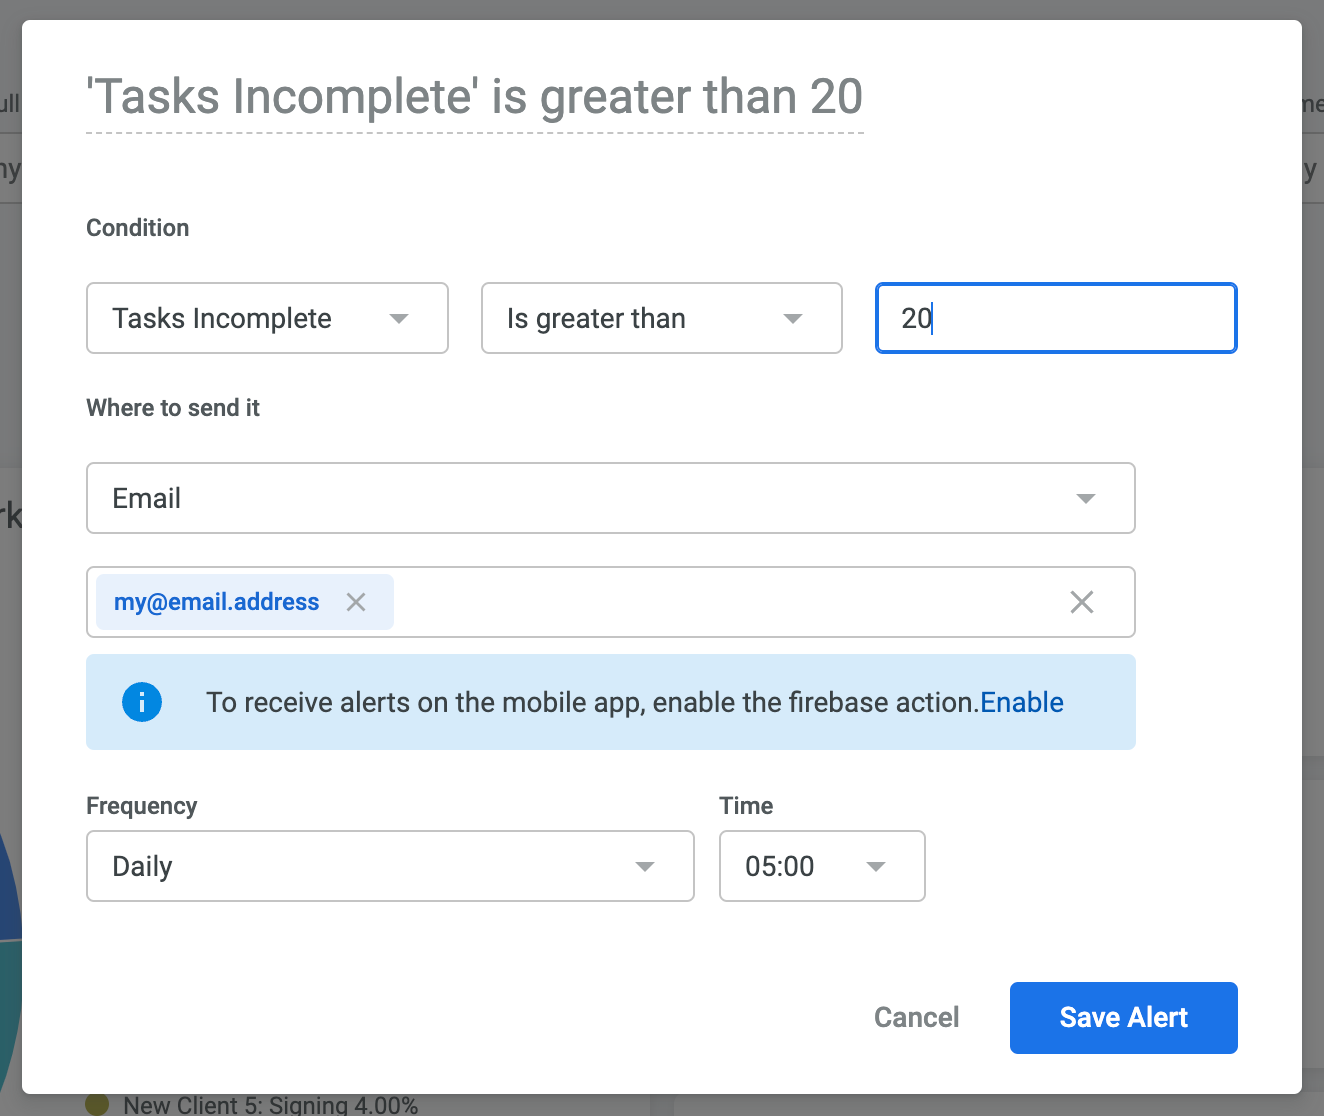
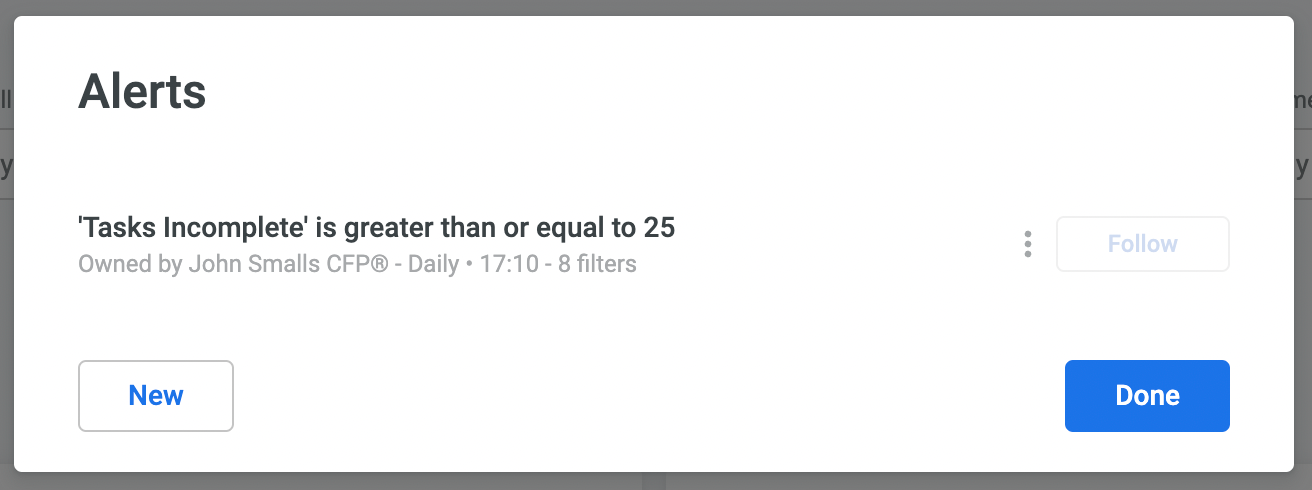
When you’re done, click the Save Alert button. You’ll see your new alert in the list, and will now receive email alerts any time your trigger condition is met:
Try it out for yourself and don't forget to Like and Leave Your Feedback letting us know how we can continue to improve your experience in Hubly!
new
Reporting
Download Insight Dashboards Data
Any Insight Dashboard data can be downloaded, as a convenient way to:
- Share with others
- Prepare for a meeting
- Import into another system
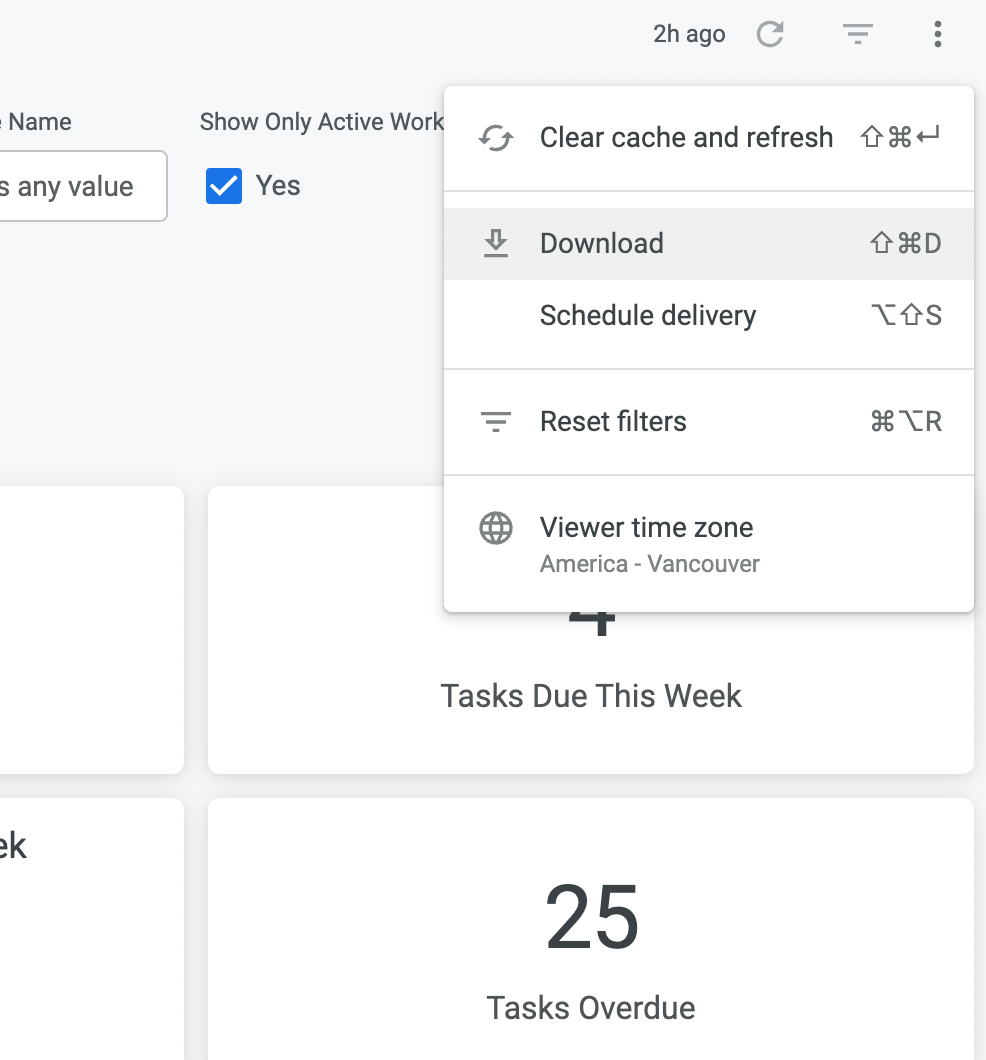
To download a report, click the ellipsis icon in the top right corner of any Insight Dashboard and select Download.
Select the format in which you’d like to download it. CSV is often convenient for importing into a spreadsheet, while PDF allows for sharing data in a more visual way.
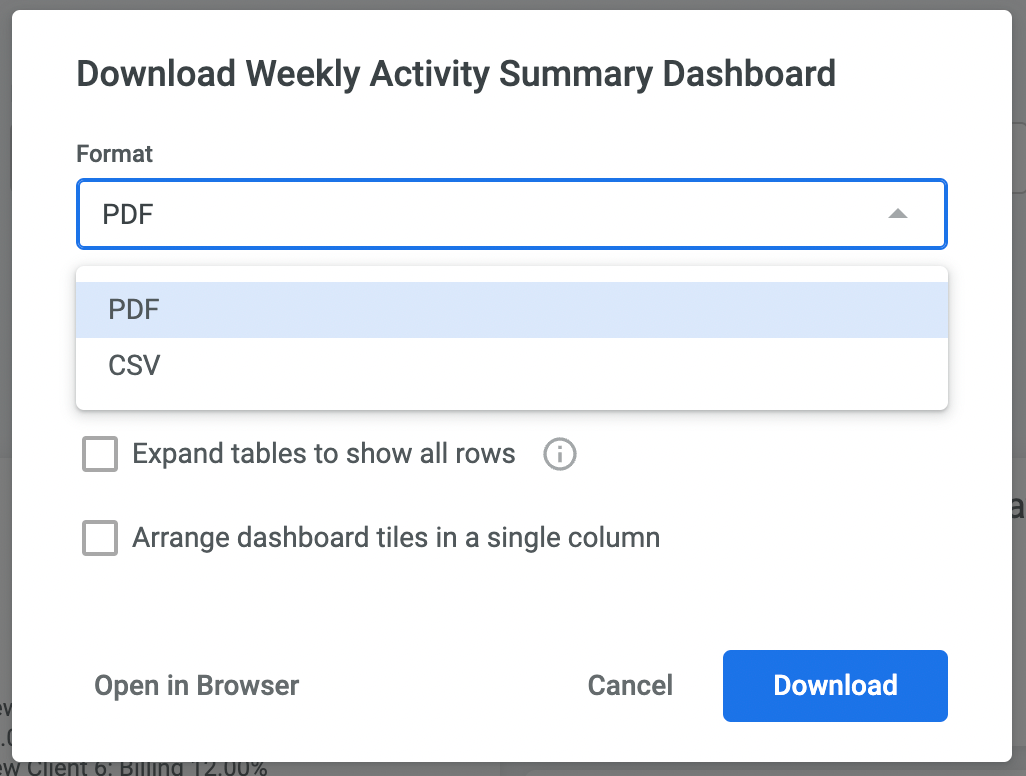
When you’re done, you can click Open in Browser to display the report separately in a new tab (if PDF was selected), or click the Download button to directly download the file.
Try it out for yourself and don't forget to Like and Leave Your Feedback letting us know how we can continue to improve your experience in Hubly!
new
Reporting
Schedule Insight Dashboard Email Deliveries
Scheduling Dashboard deliveries is a convenient way to
receive regular snapshots of the dashboard data that’s important to you
. With scheduling, you can:- Schedule Dashboard data to arrive in your attendees inboxesahead of a meeting
- Provide others in your firm access to particular Insight Dashboards, even if they don’t have Insight Dashboards enabled
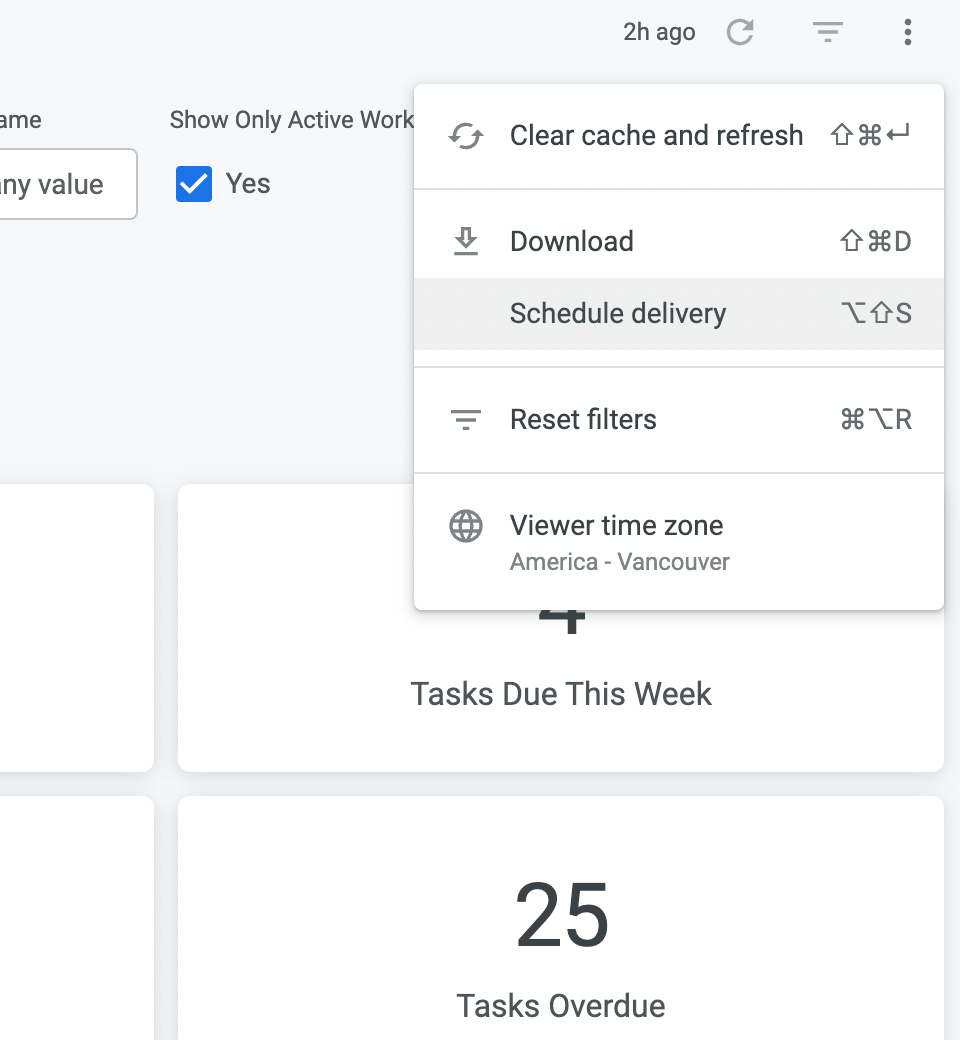
To schedule a report delivery, click the ellipsis icon in the top right corner of any Insight Dashboard and select Schedule Delivery:
On the Settings tab, provide a name for your scheduled report, and use the dropdowns provided to select when and how often you’d like it to be scheduled: 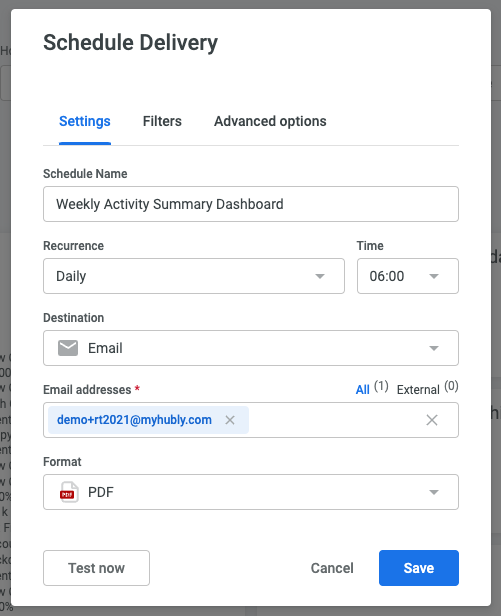
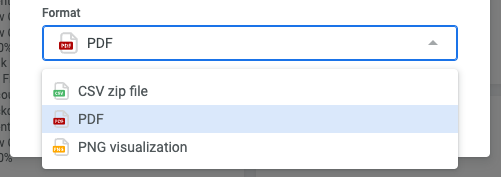
Provide one or more email addresses to send the report to, and select the format in which you’d like to receive it. CSV is often convenient for importing into a spreadsheet, while PDF or PNG allow for sharing data in a more visual way.
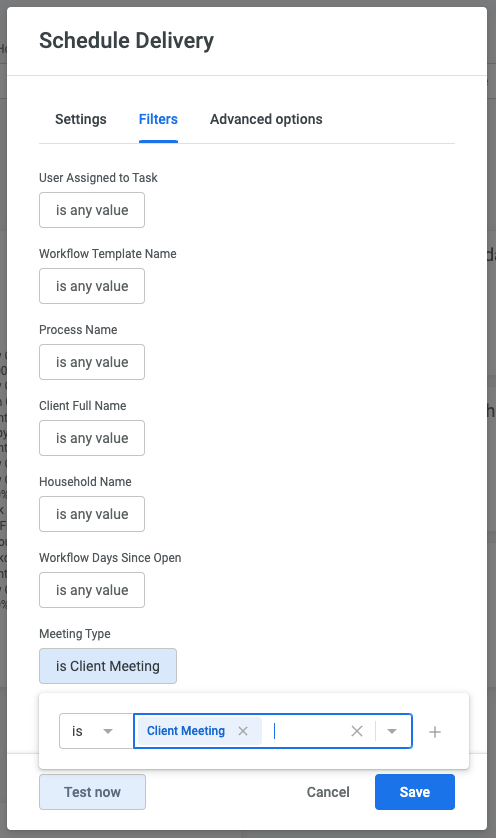
On the Filters tab, you can customize any of the dashboard filters for the purposes of the report, if desired.
When you’re done, click the Save button. You’ll see your new scheduled report in the list, and it will be delivered in the format and on the schedule you set up.
Try it out for yourself and don't forget to Like and Leave Your Feedback letting us know how we can continue to improve your experience in Hubly!
Load More
→